1. Introduction
2. Water
2.1 Usage
2.1.1 General usage notes
Values of usage for appliances come from the manufacturer specification. For toilet use I tracked the number of flushes over a three-week period and effectively doubled them, because we have two toilets. I estimated the length of the shower, but measured the flow rate of our low-flow shower head.
| Activity | Use | Frequency |
| gal/day | per day | |
| Bill showers | 5 | 0.57 |
| Sandra showers | 17 | 0.57 |
| Bill toilet | 4.5 | 3.53 |
| Sandra toilet | 2.6 | 2.02 |
| Dishwasher | 3.4 | 0.57 |
| Clothes washer | 11 | 1.00 |
| Total | 43.6 |
Figure 1 below shows the daily water consumption since 1992. Colors and symbols identify the season. The annotations indicate major life changes and installation and use dates of water-consuming appliances.
Over the past thirty years, Sandra spent 2 years living full-time in Albany, and has stayed in Baltimore first four or five days a week, but since 2023, three days per week.
 |
| Figure 1. Water usage since 1992 |
2.1.2 Findings
- Our water use has generally decreased from about 80 gal/day to the present 40 gal/day from the 1990s to present.
- None of the high-usage quarters (Usage>100 gal/day) were in the winter quarter.
- Note the general drop in usage 2005—2007 when Sandra lived in Albany.
- The largest drop in usage correlates with the replacement of the old toilet in 2017.
- Despite Luecke post-retirement, usage remains low.
2.1.3 Conclusions and Inferences
- The new washer (11 gal/wash vs. 35 gal/wash) was canceled out by Luecke retirement.
- Heavy usage in the 1990s could be due extensive lawn watering.
2.1.4 Recommendations
- Very little extra efficiency on water use is possible.
2.2 Cost
2.2.1 Background
- Water bill is issued quarterly, includes charges for both supply and sewer.
- Water is billed in units of 1000 gallons.
- In 2014, the Virginia supreme court mandated that Falls Church City sell its water system, which supplied much of Northern Virginia inside the beltway, to Fairfax Water Authority.
- Our sewage is handled by the AlexRenew plan on Cameron Run in Alexandria.
2.2.2 Rate and Total Cost
 |
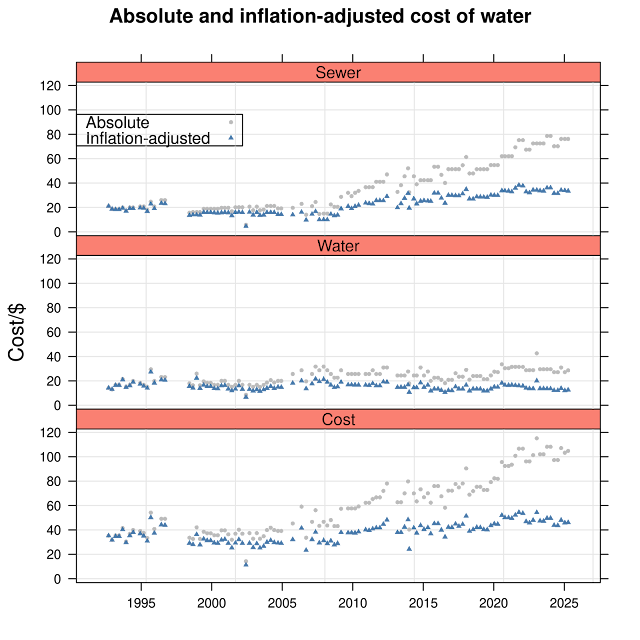
| Figure 2. Absolute and inflation-adjusted water rate |
 |
| Figure 3. Absolute and Inflation-adjusted quarterly water cost. |
2.2.3 Findings
- Sewage disposal is main driver of cost after 2008.
- Sewage disposal costs have outstripped the rate of inflation by 4x since 2008.
- Inflation-adjusted water supply costs have not changed in thirty years.
2.2.4 Conclusions and Inferences
- The payback time on a 2 gal.flush toilet over a 4 gal/flush toilet, assuming that the toilet cost is $200 and you install it yourself is only 470 days: $150/((7.1 flushes/day * 2 gal/ flush) * $0.03/gal). Paying a plumber $300 for the installation drives the payback time to about 3.2 years, which is still a rapid return on investment
- Despite our roughly 2/3 reduction in water use, our water bill has doubled since 1995.
- It seems reasonable that sewage costs have increased, presumably due to reduced tolerance for dumping raw sewage into the Potomac River.
- I had originally thought that the court-ordered sale of the water company to FC drove the price increase, but the sewage price increases, which had always been controlled a different authority, started in six years before the sale.
2.2.5 Links
This website http://www.virginiaplaces.org/watersheds/fairfax-fallschurch.html summarizes the history of the Fairfax Water Authority/Falls Church Water Company battle.
Sewage from our neighborhood goes to the AlexRenew treatment plan in Alexandria. Maps here: https://www.fairfaxcounty.gov/publicworks/wastewater/wastewater-treatment
3. Gas
3.1 Introduction
3.1 Climate change in Northern Virginia
3.1.1 Summary plots
 |
| Figure 4: Heating degree days per year since 1999. |
3.1.2 Findings
- The number of heating degree days, HDD per year has decreased about 20% since 2000.
3.2 Gas Usage
 |
| Figure 5: Gas use in therms in months when it is likely that the furnace is off. |
3.2.1 Findings for gas use
- Figure 5 shows that installation of a new water heater only partially reduced cut the gas use during months with no heat from about 6 therms/month to 4 therms/month.
- Gas, presumably for water heating, rose during the COVID-19 work-from-home era.
- Gas use has remained at about 4 therms/month even though Sandra is only working and staying 3 days /2 nights per week in Baltimore, and William is retired.
- I have no explanation for high usage 2008-2014, although that era was near the end of life of our original water heater, which came with the house in 1992.
3.3 Gas Cost
3.3.1 Summary Plots
 |
| Figure 6: Yearly gas cost |
3.3.2 Findings
- In absolute terms, the cost for gas has remained effectively unchanged for the last 25 years.
- In inflation-adjusted terms, the cost for gas has decreased almost 50%, partially due to the reduction in heating demand.
3.3.3 Discussion and Inferences
- Of the $750 total per year charge for gas, $70 is cooking and hot water (4 therms * $1.5/therm) and $680 is for heat.
- In 2025 dollars, the total charge for heat over a 20-year expected life of a HVAC system is $14K. That makes it hard to justify significant extra costs for energy efficiency on a new HVAC system.
3.4 Gas Rate
3.4.1 Summary Plots
 |
| Figure 7: Gas cost rate since 2000. |
3.4.2 Findings
- Gas actually costs about 20% less in 2025 than in 2010 in inflation-adjusted dollars.
3.5 Notes
- I cannot locate any gas bills before 1999.
- Question. What is the base load of the water heater if you never draw any water out of it?
- The rate plots include the monthly "system charge" $12.40. Electricity and Water build this charge into the rate.
4. Electricity
4.1 Usage
Figure 8 shows electricity usage per month since 1992. Yellow bands denote summer months (June 21-Sept 21). Annotations describe major electric appliance installation and use periods.
Notes
- Until 2003 we used the dryer that came with the house in 1992. To hold the door shut we used a horseshoe magnet.
- After replacing the refrigerator during the 1999 kitchen rebuild we moved the original pre-1992 refrigerator to the basement. Neither WL or SH can remember when we got rid of it, though.
 |
| Figure 8: Electricity used since 1992. |
4.1.1 Findings
- General trend: 2X current energy use during 1997 - 2004.
- The current energy use is (300 < E < 400) kWh/mo
- Most high-use months occur in the summer, presumably correlated with A/C use.
4.1.2 Analysis
4.1.2.1 Lighting
Various internet sources indicate that in 2002, 85 % of bulbs in use were incandescent. I estimate the bulb distribution and duty cycle for two eras.
- 1992 usage: 390 kWh/mo from 27 incandescent + 4 T12 fluorescent bulbs.
- 2025 usage: 150 kWh/mo from 33 LED, 3CFL, 4 T12, 8 T8, and 6 48in LED
Energy use estimated that the lights are on 1/4 of the time.
The longer we have lived here, the more lamps we have installed.
4.1.2.2 Other Electrical use
I estimate the following usage from manufacturer specification sheets
- 50 kWh/mo Refrigerator 50kWh/mo = 0.07 kWh/hour
- 25 kWh/mo Dryer
- 36 kWh/mo Cable modem/Wifi/DVR
- A/C 3kW running = 35kWh/day running 12 h/day, 5 days month = 170kWh/mo
4.1.2.2.1 Notes
- Wifi/cable modem consumes 50W 24 h/day (measured)
- Dryer use estimated from 13 months of hourly electric usage. The dryer signal is a 1 hour spike at 3.2kW, which occurred 88 times. WEL air-dries most of his clothing already.
- Nighttime energy usage is 0.1 kWh per half hour = 0.2 kwH/h = 200 W 4.8kWh/day = 144 kWh/month.
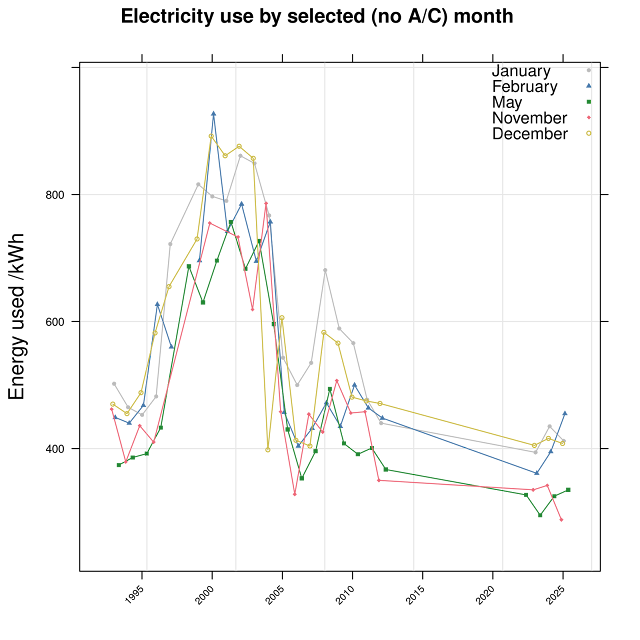
4.1.2.2 Usage Patterns
- The minimum power use is in May and November, when lighting use would be low.
 |
| Figure 9: Energy use during months where no A/C was used. |
- The nighttime base load is 0.2 kwH/h = 200W, which presumably includes the refrigerator consumption of 0.07kwH/h per hour.
 |
| Figure 10: Energy use during the week of 2024-04-28. |
4.1.3 Inferences and Conclusions
- Finishing the replacement of T8 and T12 fluorescent bulbs with LED bulbs would reduce the power need about 200 W and the use about 40 kWh/mo, which is 10% of the total.
- Very few other approaches to reducing electricity consumption appear to exist, beyond being more disciplined about shutting off lights.
4.2 Cost
Figure 11 shows the absolute and inflation-adjusted cost of electricity since 1992
 |
| Figure 11. Electricity cost per month. |
4.3.1 Findings
- Because of energy efficiency, electric bill in absolute dollars hasn't change in thirty years.
4.3 Rate
The inflation-adjusted rate has decreased (!) since 1992 from $0.10/kwH to $0.075/kWh.
 |
| Figure 12: Electricity Rate since 1992. |
-